What do people tweet?
Draw their feelings on a map
to find the answer.
What do people tweet?
Draw their feelings on a map
to find the answer.
In this project, you will develop a geographic visualization of twitter data across the USA. You will need to use dictionaries, lists, and data abstraction techniques to keep track of your intermediate steps and create a modular program. This project uses ideas from Sections 2.1-2.4 of the lecture notes.
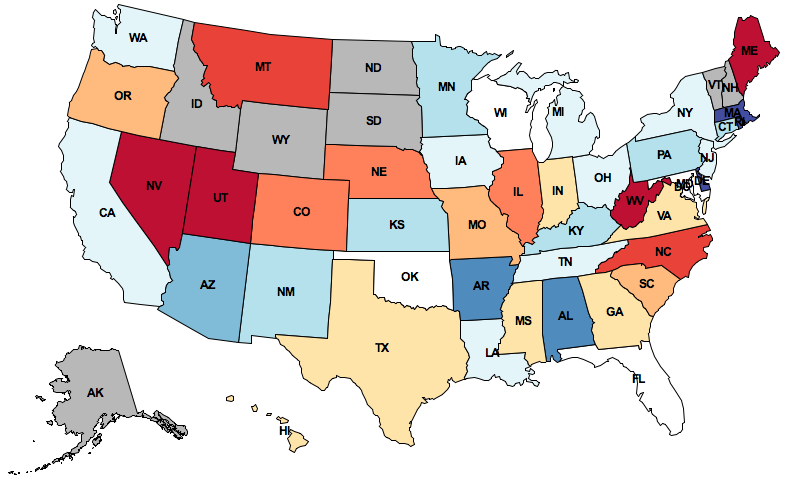
The map displayed above depicts how the people in different states feel about Texas. This image is generated by:
The details of how to conduct each of these steps is contained within the project description. By the end of this project, you will be able to map the sentiment of any word or phrase. There are two alternative zip archives related to this project:
The project uses several files, but all of your changes will be made to the first one.
|
A starter implementation of the main project file. |
|
|
Geographic positions, 2-D projection equations, and geographic distance functions. |
|
|
Functions for drawing maps. |
|
|
Functions for loading Twitter data from files. |
|
|
A simple Python graphics library. |
|
|
Utility functions for 61A. |
This is a one-week project. You'll work in a team of two people, and you can complete all problems together with your partner.
Start early! Feel free to ask for help early and often. The course staff is here to assist you, but we can't help everyone an hour before the deadline. Piazza awaits. You are not alone!
In the end, you and your partner will submit one project. There are 15 possible
points. You only need to submit the file trends.py. You do not need
to modify any other files for this project. To submit the project, change to the
directory where the trends.py file is located and run submit
proj2.
In this phase, you will create an abstract data type for tweets, split the text of a tweet into words, and calculate the amount of positive or negative feeling in a tweet.
We've gotten you started on an abstract data type for tweets. Right now, we
only have the constructor, make_tweet, defined at the top of
trends.py. make_tweet returns a python dictionary with
the following entries:
  {'text':      <a string, the text of the tweet, all in lowercase>,
   'time':      <a datetime object, when the tweet was posted>,
   'latitude':  <a floating-point number, the latitude of the tweet's location>,
   'longitude': <a floating-point number, the longitude of the tweet's location>}
Problem 1 (1 pt). Implement the tweet_words selector.
Before we can analyze the feelings in tweets, we need to access its words. We
have given you a helper function extract_words that breaks a string
up using spaces and returns a list of strings.
tweet_words is a selector function for the tweet
abstract data type that returns a list of words contained within the text of
the tweet. Call the extract_words function to extract words from a
string. You will complete the implementation of extract_words
shortly.
Problem 2 (1 pt). Implement tweet_location, which is a
selector function for the tweet abstract data type that returns a
position. Positions are another abstract data type, defined at the
top of geo.py. Make sure that you understand how to manipulate
positions; they play an important role in this project.
Problem 3 (2 pt). Implement a better extract_words
function, which takes a string and returns a list of words contained in the
string. Assume that a word is any consecutive substring of text
that consists only of letters. The string ascii_letters in the
string module contains all letters in the ASCII character set.
When you complete this problem, the doctest for extract_words
should pass. You can also call the print_sentiment function, which
is currently set as the @main function, to print the sentiment
values of all words in a line of text.
python3 trends.py "computer science is my favorite!"
Problem 4 (2 pt). Implement analyze_tweet_sentiment,
which takes a tweet (of the abstract data type) and returns a single number
averaging the weights of sentiment-carrying words in the tweet, or
None if none of the words in the tweet carry a sentiment weight.
Read the docstrings for get_word_sentiment and
analyze_tweet_sentiment to understand how the two functions
interact.
We will use the position abstract data type to represent
geographic latitude-longitude positions on the Earth. The data abstraction,
defined at the top of geo.py, has the constructor
make_position and the selectors latitude and
longitude.
In this phase, you will write two functions that together determine the centers of U.S. states. The shape of a state is represented as a list of polygons. Some states (e.g. Hawaii) consist of multiple polygons, but most states (e.g. Colorado) consist of only one polygon (still represented as a length-one list).
Problem 5 (2 pt). Implement find_centroid, which takes a
polygon and returns three values: the coordinates of its centroid and its area.
The input polygon is represented as a list of position abstract
data types, which are the consecutive vertices of its perimeter. The first
vertex is always identical to the last.
The centroid of a two-dimensional shape is its center of balance, defined as
the intersection of all straight lines that evenly divide the shape into
equal-area halves. find_centroid returns the centroid and area of
an individual polygon.
The formula for computing the centroid of a polygon appears on Wikipedia. The formula relies on vertices being consecutive (either clockwise or counterclockwise, both give the same answer), a property that you may assume always holds for the input.
When you complete this problem, the doctest for find_centroid
should pass.
Problem 6 (2 pt). Implement find_center, which takes a
shape (a list of polygons) and returns a position, its centroid.
A shape is a list of polygons. Its centroid can be computed by geometric decomposition. That is, the centroid of a shape is the weighted average of the centroids of its component polygons, weighted by their area.
When you complete this problem, the doctest for find_center
should pass.
Once you are finished, remove the @main decorator from
print_sentiment and add a @main decorator to
draw_centered_map. You should now be able to draw maps with labeled
states. The labels are placed at the positions that you return from
find_center. For instance, to draw the 20 states closest to
California (including California):
python3 trends.py CA 20
The name us_states is bound to a dictionary containing the
shape of each U.S. state, keyed by its two-letter postal code. You can use
the keys of this dictionary to iterate over all the U.S. states.
In this phase, you will write functions to determine the state that a tweet is coming from, group tweets by state, and calculate the average positive or negative feeling in all the tweets associated with a state.
Problem 7 (1 pt). Implement find_closest_state, which
returns the two-letter postal code of the state that is closest to the location
of a tweet. Use the geo_distance function (provided in
geo.py) to calculate the shortest distance in miles between two
positions.
When you complete this problem, the doctests for
find_closest_state should pass.
Problem 8 (2 pt). Implement group_tweets_by_state, which
takes a list of tweets and returns a dictionary. The keys of the returned
dictionary are state names (two-letter postal codes), and the values are lists
of tweets that appear closer to that state's center than any other.
When you complete this problem, the doctests for
group_tweets_by_state should pass.
Problem 9 (2 pt). Implement calculate_average_sentiments.
This function takes the dictionary returned by group_tweets_by_state and
also returns a dictionary. The keys of the returned dictionary are the state names
(two-letter postal codes), and the values are average sentiment values for all the
tweets in that state.
If a state has no tweets with sentiment values, leave it out of the dictionary entirely. Do not include a states with no tweets, or with tweets that have no sentiment, with a zero sentiment value. Zero represents neutral sentiment, not unknown sentiment. States with unknown sentiment will appear gray, while states with neutral sentiment will appear white.
Once you are finished, remove the @main decorator from
draw_centered_map and add a @main decorator to
draw_map_for_term. You should now be able to draw maps that are
colored by sentiment corresponding to tweets that contain a given term.
python3 trends.py sandwich
python3 trends.py obama
python3 trends.py texas
python3 trends.py "my life"
If you downloaded the small version of the project, you will only be able to map these four terms. If you would like to map any term, you will need to download this Twitter data file and place it in the
data directory of your project.
Congratulations! One more 61A project completed.
These extensions are optional and ungraded. In this class, you are welcome to program just for fun. If you build something interesting, come to office hours and give us a demo.
:-) and negative sentiment to sad ones.
find_closest_state with a function that finds the state that
actually contains a tweet position.
tweet has a
datetime
object that should prove useful in this extensions.
graphics.py package supports animation. Use the
slide_shape method to have states and dots slide into place.
Acknowledgements: Aditi Muralidharan developed this project with John DeNero.